What is this Gaia Snail, or Gaia Phase Spiral?
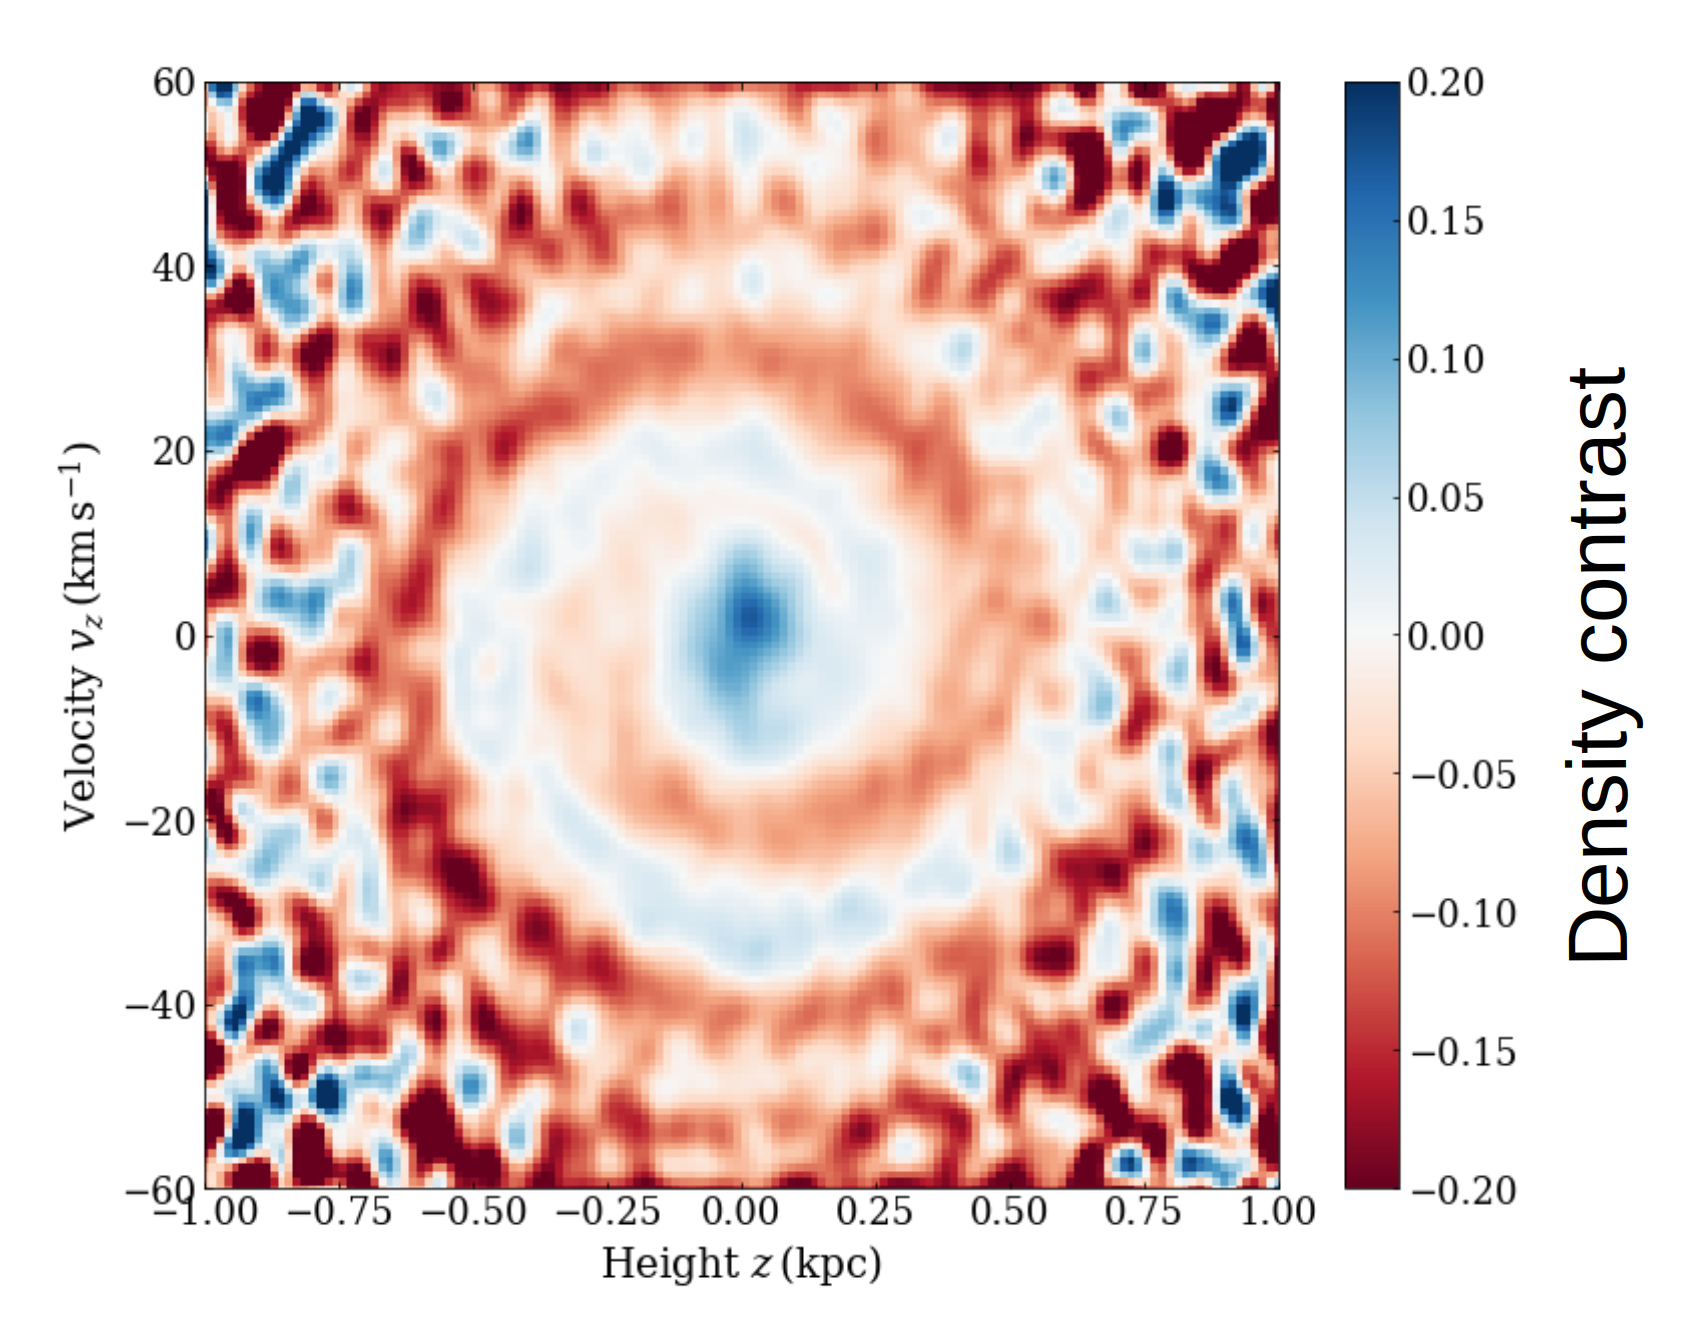
The Gaia Phase Spiral, or Gaia Snail, is this beautiful-looking spiral feature discovered in Gaia DR2 data by T. Antoja (ICCUB), in the plane of Galactic height (i.e. position perpendicular to the midplane of the Galactic disk) - vertical velocity (the motion perpendicular to the disk). It is illustrated below with data from Gaia DR3. The color coding shows the density contrast, i.e. the fractional difference of stars on different orbits and phases. Bluer regions mean that there are more stars than average in these regions of phase space.
It is called the Gaia phase space spiral, shortenned into Gaia phase spiral. That name is quite long and cannot be shortned to simply 'spiral' because spiral already means something else (the spirals we see in pictures of galaxies). So an even shorter name that described what it looks like: the Gaia Snail. Its existence shows that stars in our Galactic disk occupy preferentially some phases of their orbits than others. This is surprising if we think that stars are usually born right into the midplane of the Galactic disk no (or small) vertical motion, and as time goes they get random kicks up and down and acquire random vertical motion: if it all random, there should be no preffered orbital phase. So how did the stars end-up in a phase spiral?
Showcase with the Classical Pendulum
The pendulum is often used as an example to derive the harmonic oscillator equations. There are several ways of getting there, and one of them consists in doing a Taylor expansion of the potential $V(\theta)$ to second order. In particular, we write the energy of a pendulum of length $L$ and with the gravitational acceleration at the surface of the Earth $g$ as $$E = \frac{L^2\dot{\theta}^2}{2} - gL \cos(\theta) + \mathrm{const.}$$ where $\theta$ is the angle of the pendulum with respect to the vertical axis, and $ \dot{\theta} $ is its time derivative, the angular velocity. This is the simple sum of the kinetic and potential energy. But it leads to equations of motions that cannot be solved analytically. So when the amplitudes are small, i.e. $\theta << 1$, we can expand this expression around 0 as $$E \approx \frac{L^2\dot{\theta}^2}{2} - gL (1 - \frac{1}{2}\theta^2) + \mathrm{const.}$$ And when you solve the equation of motion that you get from this, you get the harmonic oscillator solution, at any time $t$ and dropping the pendulum for an angle $\theta_\mathrm{max}$: $$\theta(t) = \theta_{max} \cos(\Omega t)$$ with $\Omega = \sqrt{\frac{g}{L}}$. This equation shows that when the pendulum deviation is small, the pendulum period (or frequency) is always the same. It is independent of its energy (and this is what we call 'harmonic' motion: there is a unique frequency). But this is only valid at small amplitudes. In fact, the general solution, that works at larger amplitudes too, is anharmonic, i.e. the pendulum period increases with the amplitude (or energy). You can think of the limiting case where you leave the pendulum right at $\theta=\pi$, i.e. vertical, just above its pivot. It will slowly start to fall down, pass the point $\theta=0$ rapidly, but then take an infinite amount of time to come back up to its initial point!
The animation below illustrates a hundred pendula. The left panels shows t hem as they swing in physical space and the right panel shows them on their phase space (angle versus angular velocity). In this animation, the pendula's energies (their colors: low energy in blue, high energy in yellow) are randomly distributed, and so is their phase. There is nothing special to notice about that plot, except that due to their anharmonicity at larger amplitudes (or energies), the yellow pendula have a longer period. They take longer to go over their swing. If the pendula were stars in the Galactic disk, we would say that they are currently at equilibrium and phase-mixed.
This animation was done in Python, using the packages Numpy and Matplotlib. Credit: Neige Frankel
Now, what happens if we suddenly decide to kick all the pendula to the right? On average, just as we kick them, their average net motion is going to be to the right. So overall, they will tend to be on a specific phase of their orbit (swinging to the right!). Since the motion is anharmonic, i.e. pendula with higher amplitudes have longer periods, the higher amplitude pendula are going to start to lag behind the others in the phase space plane. And if you wait for long enough, a spiral pattern that winds up with time is going to form. The animation below illustrates exactly this effect. After enough time, the system becomes sufficiently phase mixed and the spiral disappears. So: pendula, when kicked, can make a Snail-looking pattern, due to their anharmonic motion. That's some good insight we can use for the Milky Way pattern!
This animation was done in Python, using the packages Numpy and Matplotlib. Credit: Neige Frankel
Orbits in our Galactic disk
In the Milky Way, we can think in a similar way about the vertical orbits of the stars. Replace the pendula by stars in the example above, and replace the net force on the pendula (gravitational force from the Earth and the tension from the rope) by the gravitational field in the Milky Way. Since in the Milky Way disk, the distribution of matter is not uniform, the gravitational potential is not harmonic (mass distribution and gravitational potential as related via Poisson's equation for the reference, but this is beyond the scope of this post).
If the stars in the Milky Way disk got kicked, then the perturbation phase-mixes and ends up in a Snail. The animation below shows the vertical phase space plane (heights above the Milky Way disk versus vertical velocity) for a set of stars that got perturbed by a positive velocity kick at $t = 0$. The stars have a range of energies (as for the pendula example), and as time goes the perturbation winds up in a spiral pattern. But what produced the kick?
This animation was done in Python, using the packages Numpy, Matplotlib and Galpy. Credit: Neige Frankel
What has perturbed our Galaxy? A few theories.
Plenty of scenarios could have resulted in a Gaia Snail-looking structure. As detailed above, under some assumptions, the degree of winding of the Snail can tell something about the time when the perturbation happenned. Various works have estimated that time to be between 200 Myr and 800 Myr (for example Frankel et al. (2023) and references therein). This time window coincides with when the Sagittarius dwarf galaxy, currently orbiting the Milky Way, came and crossed the Milky Way disk. This could well have kicked the stars in a similar way as in the animation above. However, there are issues with this scenario: it seems that the Sagittarius dwarf galaxy may not be massive enough to produce a signal as strong as what we see in the data, and the timing is actually not very well defined: looking at stars that are at different places of the galaxy gives different answers.
Additionally, other dynamical effects could come in and make that signal harder to interpret. For example, self-gravity (once all the stars got kicked, their mass distribution changes, and so does the gravitational potential that they create and that determines their motion). This could affect the measurement of the timing of that event, especially if it is recent! (e.g. Widrow, 2023)
What if there were more than one event? We know there are other satellite galaxies orbiting the Milky Way. If you take the extreme scenario where there are MANY of them, perturbing the disk ALL the time, then you can still get a similar-looking snail! And this time, the degree of winding will have nothing to do with a specific date of a specific traumatic event: it reflects a competition between two effects: the perturbations that come in, and how quickly they "disappear", i.e. how quickly the Galactic disk forgets about it due to perturbations from other things, like giant molecular clouds etc. ( see e.g., Tremaine, Frankel, and Bovy 2023)